El Cerrito means “the little hill” in Spanish, and it’s the origin of our team’s name. Rachel Melby moved here in 2015 and started @thelittlehill to share the trails, views, and local places she loved. That community connection eventually grew into Little Hill Real Estate.
For buyers, much of the appeal is the range: tree-lined flats near two BART stations, winding hillside streets with Bay views, unique, mid-century architecture, and quick access to Albany, Berkeley, Richmond, and Kensington.
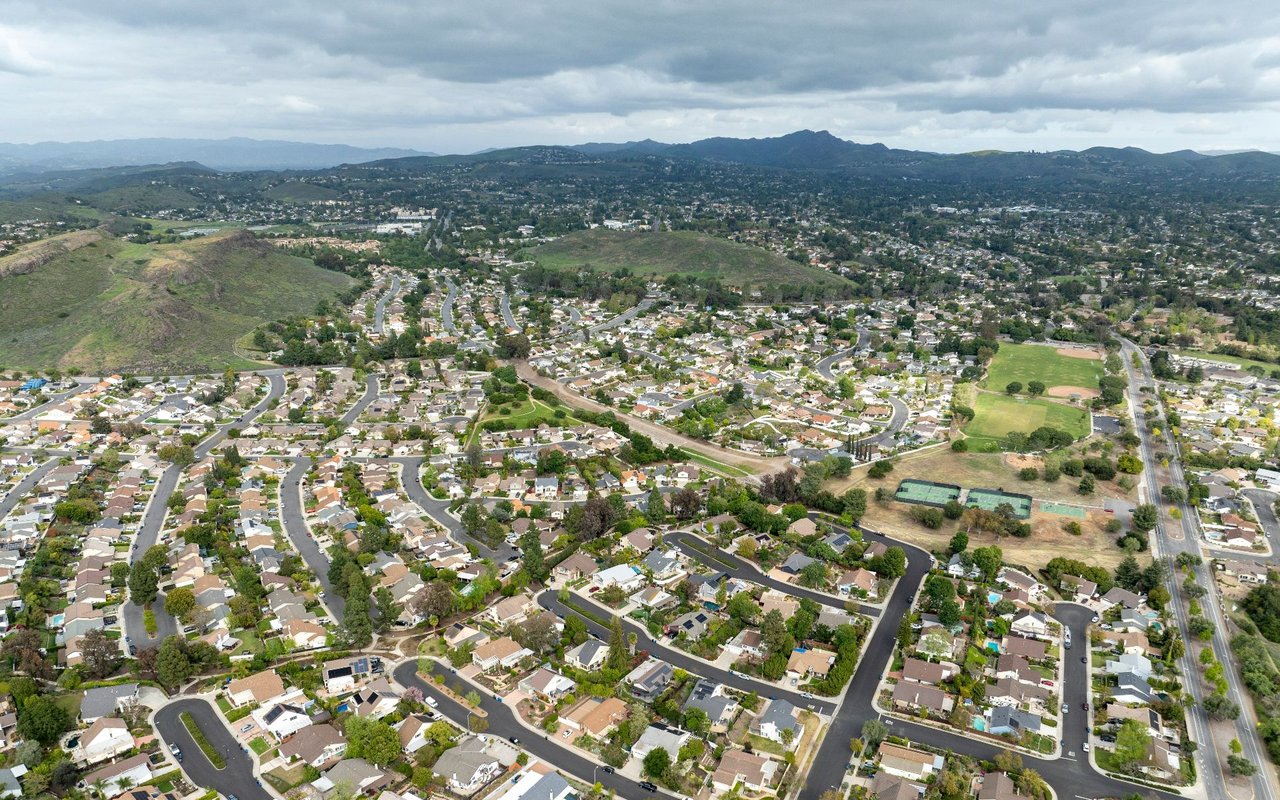
El Cerrito changes noticeably from West to East. In the flats, streets largely follow a grid, with many homes near BART, the Ohlone Greenway, parks, and San Pablo Avenue. Farther east, the streets climb and curve into the hills, where homes often have more varied floor plans, sloped lots, and views across the Bay.
Much of El Cerrito took shape during and after World War II. The city’s Housing Element notes its largest share of housing was built from 1940 through 1959, and detached houses make up most of the city’s housing stock.
Mid-century homes are one of El Cerrito’s architectural signatures. The El Cerrito Historical Society documents work by Richard Neutra, Roger Lee, Henry Hill, Donald Hardison, and other modernist architects throughout the hills. Buyers may also encounter quaint cottages, California bungalows, Spanish Revival homes, ranch houses, duplexes, townhomes, and condominiums.
El Cerrito is served by two BART stations: El Cerrito Plaza in the south and El Cerrito del Norte farther north. For people commuting into Oakland or San Francisco, that transit access is one of the city’s clearest upsides.
Running alongside the BART tracks, the Ohlone Greenway stretches over two-and-a-half miles through El Cerrito, linking residential blocks with parks, shopping, and neighboring communities. And at the El Cerrito Plaza, the year-round farmers market runs on Tuesdays and Saturdays.
San Pablo Avenue is the city’s main commercial corridor, while El Cerrito Plaza and smaller clusters around Fairmount, Central, Stockton, and Moeser provide groceries, restaurants, services, and everyday errands. El Cerrito also sits close enough to Solano Avenue, North Berkeley, Kensington, and Richmond that residents regularly move between communities.
Outdoor access is also a defining part of life in El Cerrito. The Hillside Natural Area opens onto trails and broad Bay views, while some of the city’s parks and recreation facilities include Cerrito Vista Park, Canyon Trail Park, Huber Park, the Community Center, and the El Cerrito Swim Center.
El Cerrito addresses are served by West Contra Costa Unified School District. Schools located in the city include Harding, Fairmont, and Madera elementary schools, Korematsu Middle School, and El Cerrito High School, which is known for its long-running jazz program.
Rachel Melby
Bay Beauty Spa: “Unpretentious day spa with a wide array of services — from massages to facials and body scrubs. I come here anytime I have an hour to spare.”
Mile’s Pizza Slice: “Local El Cerrito dad turned his passion into a slice shop and the crust is a 10/10 — he’s nailing it.”
Rachel Sheftel
FatApples: “Large restaurant great for groups and solo diners alike. Their famous cheesepuffs live up to the hype and the waffle special is a sleeper hit.”
Rialto Cinemas: “This Art Deco theater shows all kinds of great movies, new and old. It’s an absolute classic.”
Buying in El Cerrito starts with choosing between the differing versions of the city.
The flats offer easier access to BART, the Ohlone Greenway, shopping, and neighboring Albany and Berkeley.
The hills bring winding streets, notable architecture, open space, and views that can stretch from the Bay Bridge to the Golden Gate.
Most homes will be older, so make sure to review foundation and seismic work, electrical and plumbing systems, roof and drainage history, permits, and converted or lower-level spaces. In the hills, buyers should also understand slope, drainage, retaining walls, vegetation management, wildfire requirements, evacuation access, and insurance availability. Lot orientation matters, too: it can affect sunlight, views, outdoor space, and how different floors connect to the yard.
For buyers drawn to mid-century homes, Bay views, nearby trails, two BART stations, and easy connections to the rest of the Inner East Bay, El Cerrito offers a distinctive balance. We know how much the experience can change from one block to the next because this is where Little Hill began — and where we still live, work, and spend our days.
26,229 people live in El Cerrito, where the median age is 42.5 and the average individual income is $72,917. Data provided by the U.S. Census Bureau.
Total Population
Median Age
Population Density Population Density This is the number of people per square mile in a neighborhood.
Average individual Income
El Cerrito has 10,923 households, with an average household size of 2.39. Data provided by the U.S. Census Bureau. Here’s what the people living in El Cerrito do for work — and how long it takes them to get there. Data provided by the U.S. Census Bureau. 26,229 people call El Cerrito home. The population density is 6,057 and the largest age group is Data provided by the U.S. Census Bureau.
Total Population
Population Density Population Density This is the number of people per square mile in a neighborhood.
Median Age
Men vs Women
Population by Age Group
0-9 Years
10-17 Years
18-24 Years
25-64 Years
65-74 Years
75+ Years
Education Level
Total Households
Average Household Size
Average individual Income
Households with Children
With Children:
Without Children:
Marital Status
Blue vs White Collar Workers
Blue Collar:
White Collar: